Lots of little fixes (and some tighter access control)
Role-based access control across team and account management
Team and account management endpoints now enforce owner/admin roles. Inviting or removing members, cancelling invitations, changing member roles, listing members and invitations, managing API tokens, registry and license-token access, and account domain changes are all now restricted to owners and admins. Members without the right role receive a clear permission error instead of the action going through.Clearer error messages
- Domain verification failures now return a specific
DOMAIN_VERIFICATION_FAILEDerror instead of a generic 4xx, so you can tell exactly what went wrong. - Verbose internal authentication validation errors are no longer surfaced in API responses, keeping error output clean and actionable.
Fixes
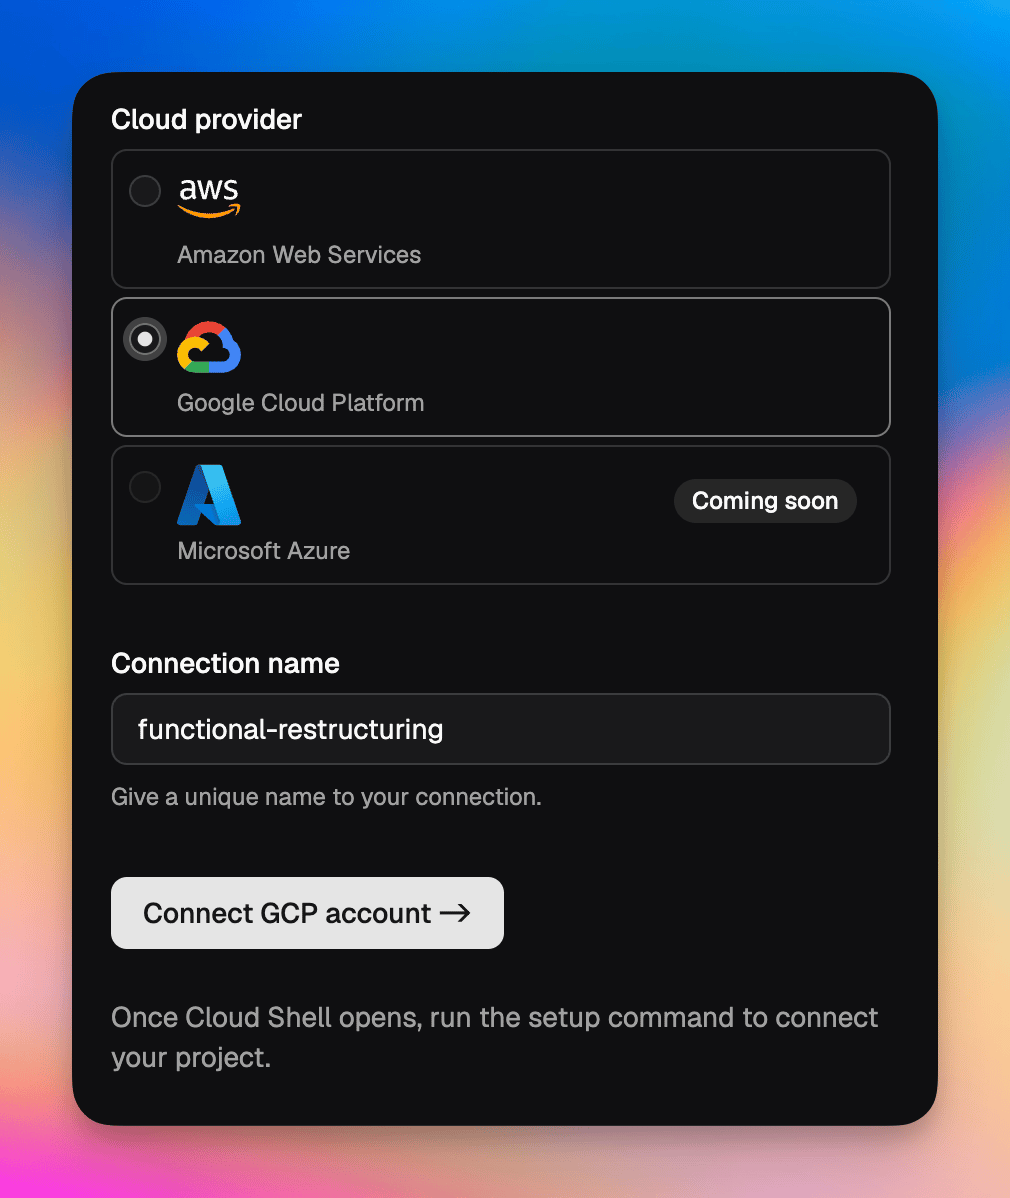
- Environment creation could sometimes fail in fresh Google Cloud projects — this has been fixed.
- Private instance lookups and updates are more robust — consistent handling of not-found instances and a fix for an edge case when updating an instance with no changed fields.
- Fixed the LocalOps CLI rendering CLI flags: the Geist Mono ligature no longer swallows the space before double-dash (
--) flags.
deploy at 2am, thanks us.Questions? Email us at support@localops.co or ping us in your Slack Connect support channel.Google Cloud support
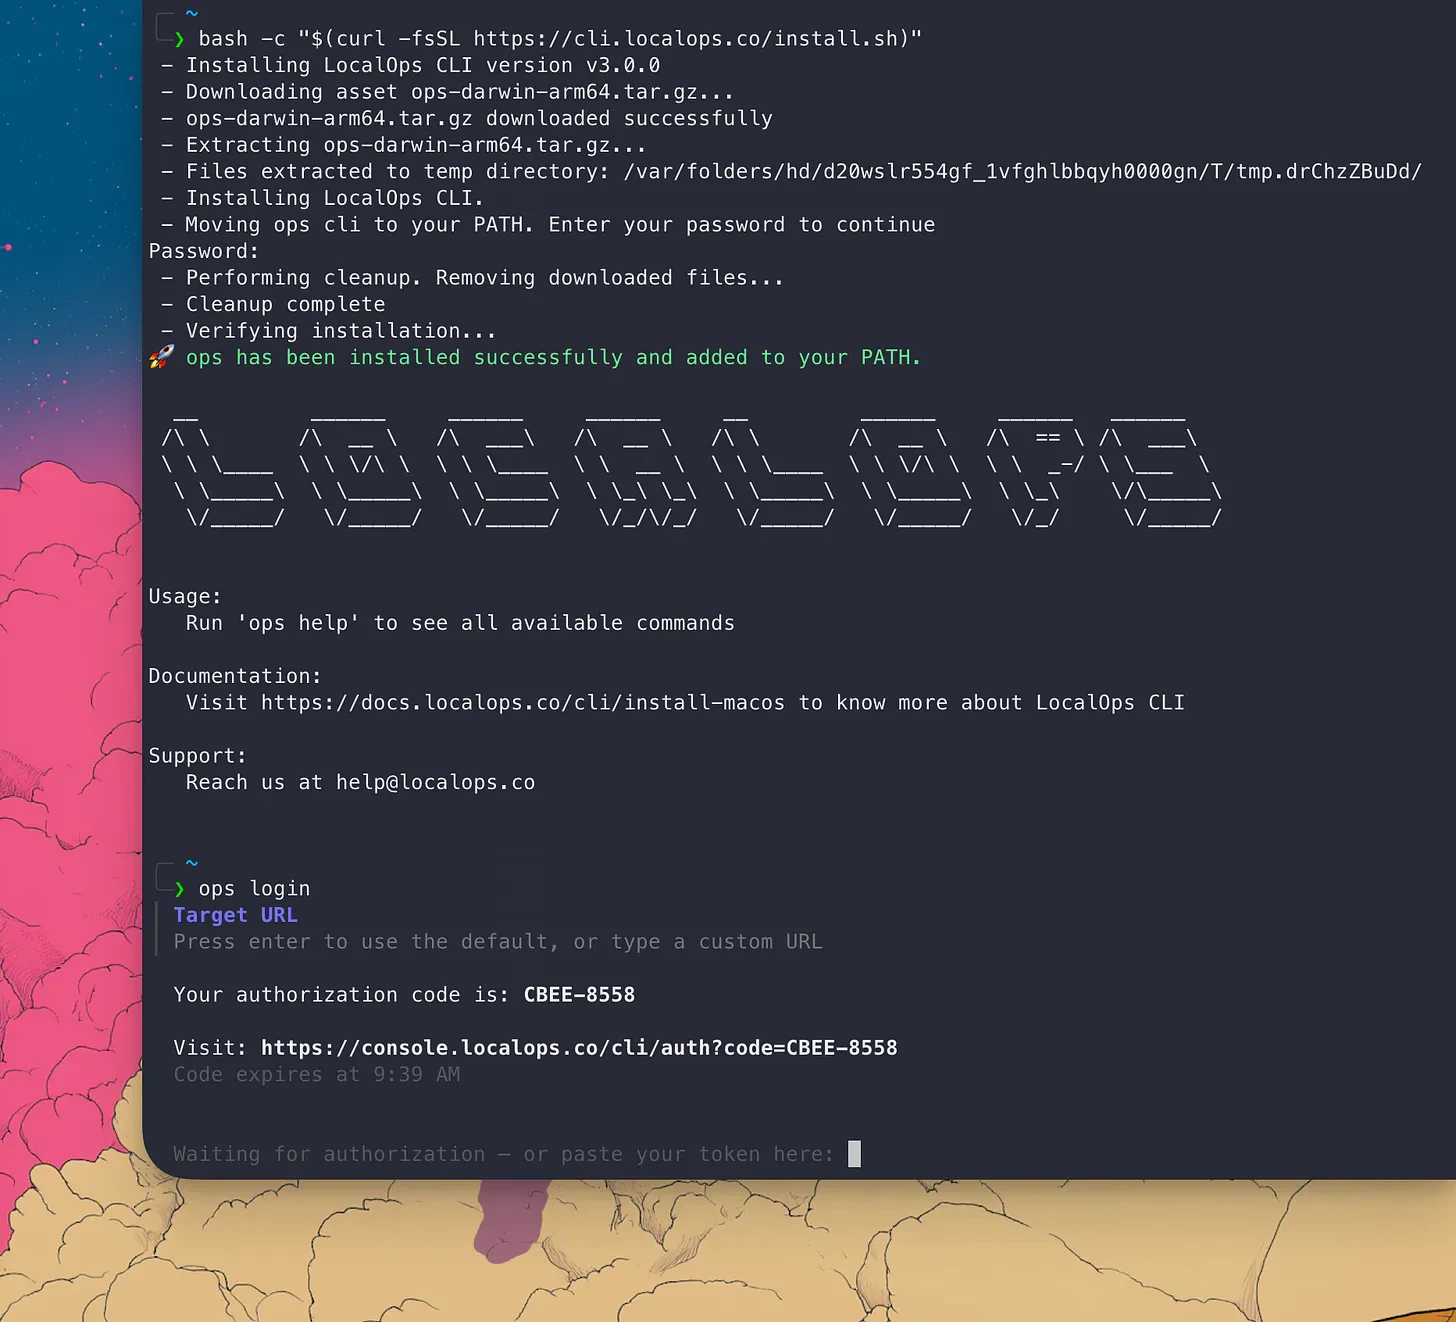
Update the CLI to v3.0.3
To use Google Cloud support, update the LocalOps CLI to v3.0.3. See the CLI install guide for how to update.Questions? Email us at support@localops.co or ping us in your Slack Connect support channel.GitLab support
You can now connect your GitLab repositories to LocalOps and enable continuous deployments on any cloud — your own cloud or your customer’s cloud. Once connected, every push triggers a deployment through the same pipeline you already use, so GitLab-hosted teams get the full BYOC, single-tenant and self-hosted experience without changing where their code lives.Changelog for each Helm chart version
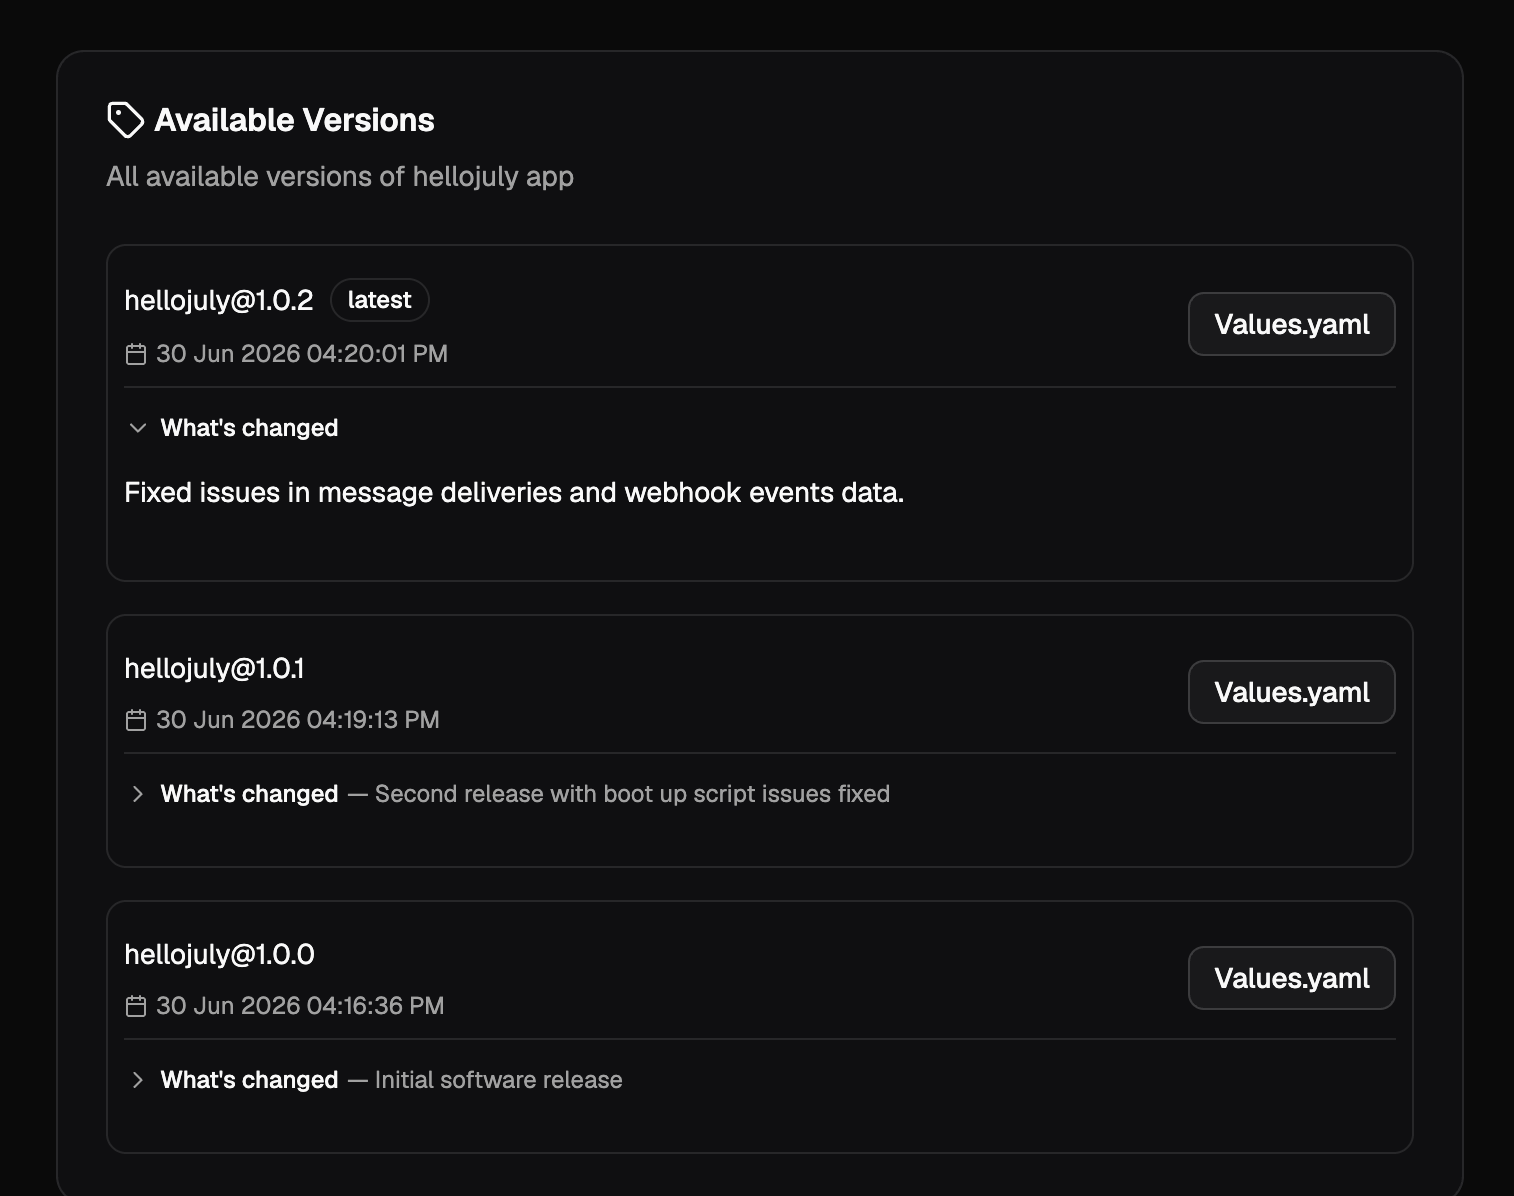
When generating a Helm chart, you can now add a changelog describing what changed in that version. The changelog is optional, supports Markdown, and appears in the chart’s release history — so the teams installing your chart can see exactly what each version brings.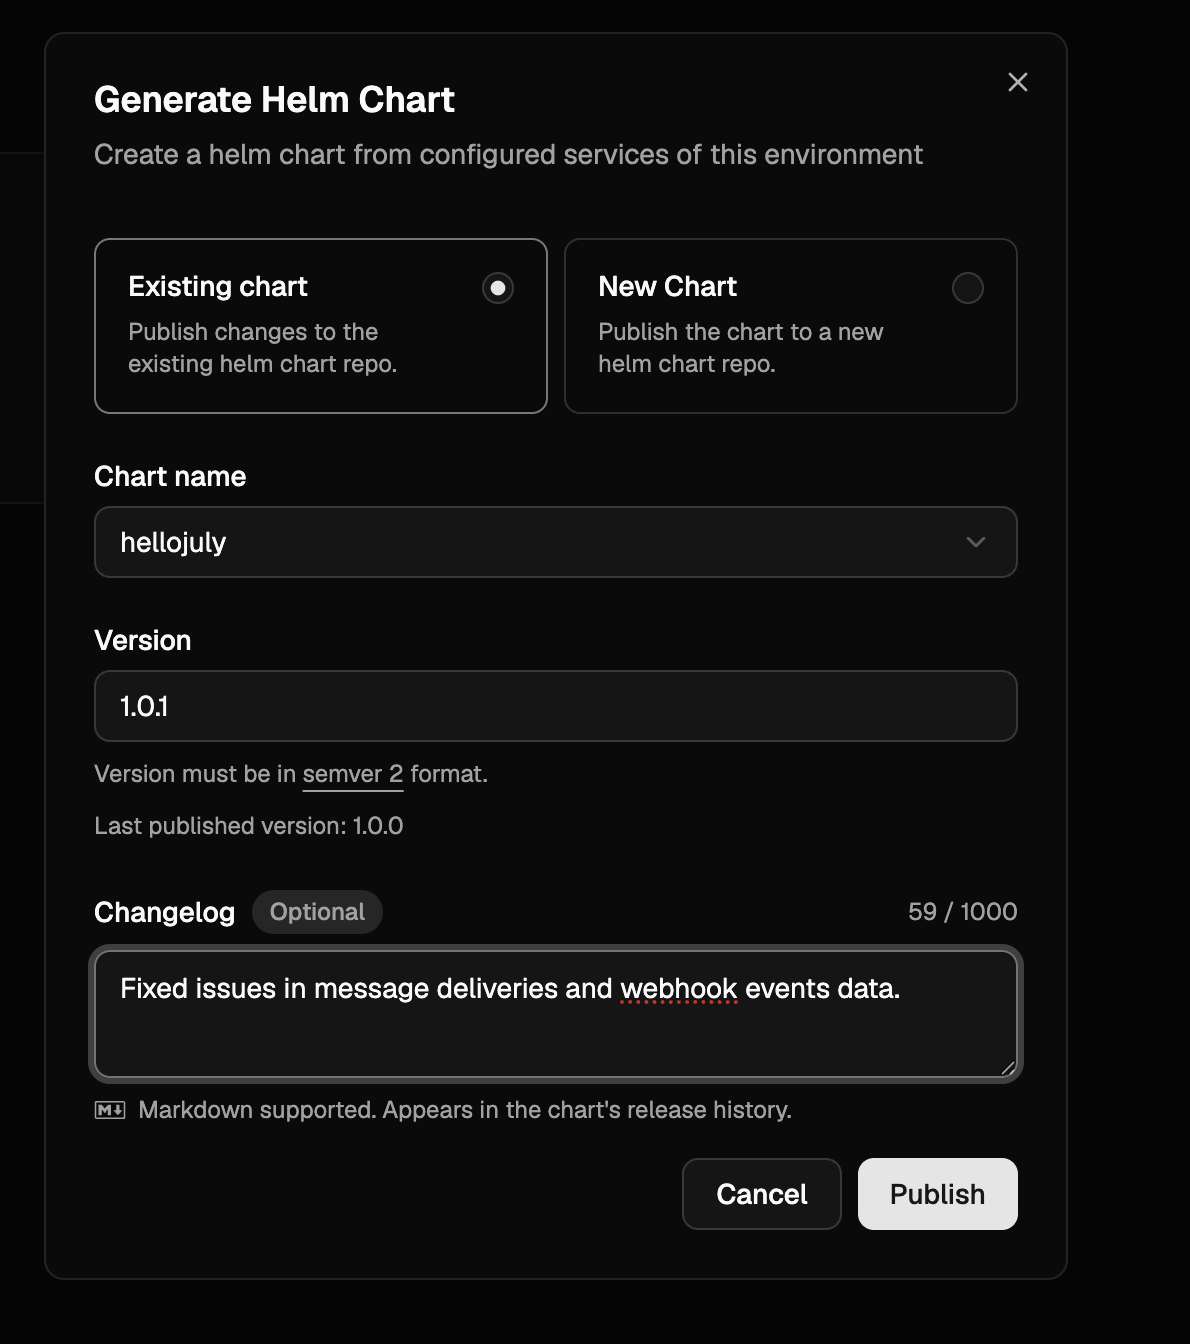
New warning when marking a Helm chart field as non-sensitive
When editing a Helm chart’s values in the console, switching a previously sensitive field to non-sensitive now prompts a confirmation dialog listing every affected key. This guards against accidentally exposing credentials or other confidential data — once a value is marked non-sensitive, it is stored and rendered in plain text.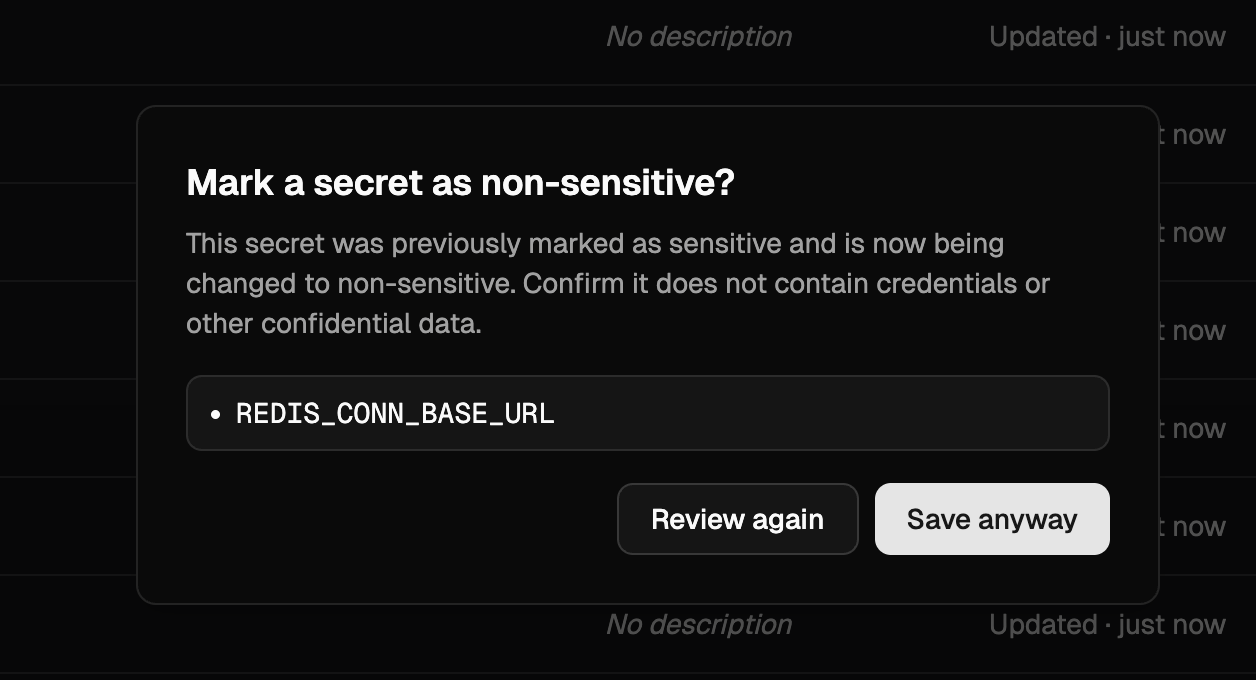
DEPLOYMENT_ID and LOPS_INSTANCE_ID built-in secrets
Every service now receives DEPLOYMENT_ID and LOPS_INSTANCE_ID as built-in environment variables. Both carry the same 24-character alphanumeric value (as unique as a UUIDv4) — unique per LocalOps-managed environment, and unique per Helm install of charts generated by LocalOps. Use either to tag logs, metrics or external resources with the originating environment.See Built-in secrets for the full list.Import environment
You can now create a new environment from one or more existing environments in just a few clicks via Import environment. In a brand new environment, click the 3-dots on the top right and choose “Import from environment”. Pick a source environment and import — all services, secrets and cloud resources (RDS, ElastiCache, S3, etc.) are copied over, with inter-dependencies preserved, so you can start deploying as soon as the import finishes.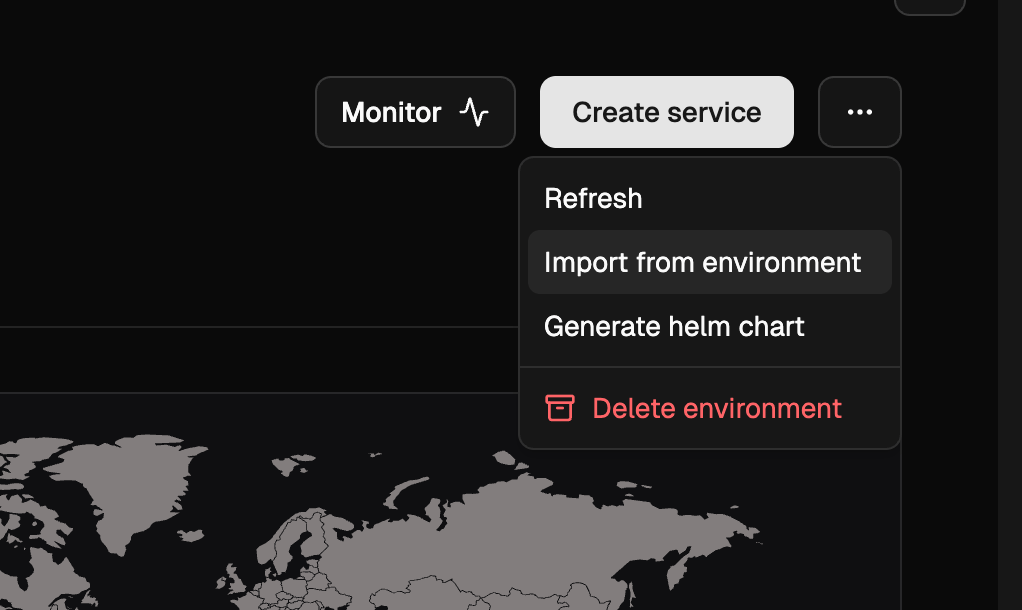
managed_password toggle for RDS
RDS instances in ops.json now accept a managed_password boolean. The default is true, where AWS RDS generates the master password, stores it in its own AWS Secrets Manager entry, and rotates it automatically. Setting it to false makes LocalOps generate a cryptographically unique string and use it as the RDS master password instead — the password is then not rotated, so this mode is not recommended. Regardless of which mode you pick, use $password and $dsn in exports to fetch the current password and connection string; LocalOps resolves them transparently in both cases.OpenSearch as a dependency
You can now declare Amazon OpenSearch domains underdependencies.opensearch.domains in ops.json. LocalOps provisions production-tuned domains by default — 3-node multi-AZ quorum, encryption at rest, node-to-node encryption, HTTPS-only with TLS 1.2, fine-grained access control with an auto-generated master user in AWS Secrets Manager, and audit logging to CloudWatch. Preview environments are automatically scaled down to a single node. See OpenSearch for the full reference.parameters for RDS and ElastiCache
Both RDS instances and ElastiCache clusters now accept a parameters list in ops.json to configure DB / cache parameter group settings inline. LocalOps creates a dedicated parameter group for the resource and keeps it in sync as you add, update or remove entries on subsequent deployments.For RDS, each entry takes a name, value and an apply_method of immediate or pending-reboot (use the latter for parameters like shared_preload_libraries that need a restart):name and value:Plaintext $password and $dsn exports for RDS
RDS exports now include $password and $dsn alongside the existing $passwordArn. $password resolves the master user password from AWS Secrets Manager and injects it directly as an environment variable, so your code does not need to call the Secrets Manager API. $dsn is a ready-to-use connection string in the form postgres://$username:$password@$address:5432/$dbName (or the MySQL equivalent) for libraries that accept a single URL. Treat both values as secrets.Import managed secrets from other services
Secrets exported viaops.json now appear in each service’s console secrets section as managed secrets. You can pull those exports into any other service in the same environment as a single secret — every key the source service exported is injected as environment variables in the importing service.This is useful for wiring databases, caches and other declared cloud resources into the services that consume them. For example, a boot script job can declare an RDS instance in ops.json and export its DSN, username and password; any other service in the same environment can then import them all in one line. See Importing other service secrets for the syntax.Search in the service switcher
The service switcher now has a search bar at the top, so you can jump to a service by typing instead of scrolling. Handy in environments with a long list of services.Deletion protection for critical services
You can now turn on deletion protection for a service from its settings. Once enabled, the service cannot be deleted until protection is explicitly turned off — a safety net for production and other critical services where an accidental delete could cause downtime.✋ Improvements and bug fixes
We have shipped a handful of bug fixes and small enhancements today to make day-to-day operations smoother. These are the kind of polish that adds up over time. Read on for the highlights.Stop and start services on demand
Each service dashboard now has a Stop button in the top right corner. Use it to scale down a service’s replica/container count to0 on demand, without deleting the service or its configuration. Click start button to bring it back up.Consistent image tag on redeploys
After updating secrets or scaling settings, users can trigger a new deployment. For docker image based services, this deployment was previously pulling the image with thelatest tag. It now uses the exact image tag from the previous deployment, so redeploys stay consistent with what was last running.Valkey support for ElastiCache
ElastiCache clusters declared inops.json can now use valkey as the engine, alongside redis and memcache. Pick a supported version from the AWS Valkey versions list. See ElastiCache for details.SSL passthrough
Services can now handle TLS termination themselves instead of letting the environment’s nginx ingress decrypt traffic. Setssl_passthrough to true in ops.json and configure your service’s port to 443 so the ingress forwards raw TLS connections directly to your container. Useful for mTLS, custom certificate handling, or any protocol requiring end-to-end TLS. See SSL passthrough for details.Instrument services with internal /metrics endpoint
You can record custom metrics and expose them to in-built prometheus monitoring stack via/metrics endpoint. Just add an ops.json file in your repository and declare “metrics” configuration as documented here - Instrument services to get started.- language run time metrics - NodeJS event loop metrics, JVM metrics, etc.,
- connection and request metrics like “tcp_connections_open”
- business metrics like “number_of_payments”
- transactional metrics like “number_of_emails_sent”
Pro tip - Checkout the language specific guides to learn how you can unveil advanced metrics & dashaboards in just few mins of setup (eg: See this Java guide)
Request timeouts
Set timeouts for TCP connections or requests handled by your services. Default timeout 60s may not be suitable for realtime applications with long running connections. Start declaring custom timeout values in ops.json as specificed in developer docs - Request timeouts.Private IPs passed as environment vars
POD_IP and HOST_IP are now injected in each service as environment variables. So if your application requires its own IP address, you can fetch and utilize in your business logic.Learn more about built-in environment vars like these.Other UI enhancements and fixes
- Saving secrets triggers a “Write secrets” op to keep track of secret updates
- While creating new service, search for repositories using the new search bar in the repository picker
- Bug fixes in Member invite workflow
- Bug fixes in preview environments
- Other fixes in slack and ms teams notificaitons
Projects revampled
We have revamped Projects. You can now create projects and organize environments in them.Members
Projects can have members. Unless an org member is also added as a project member, they can’t see the project’s environments or deploy to them.Revampled navigation bar
Sidebar navigation menu is revamped to make it easy to switcher between organization and projects.Other bug fixes and UI enhancements were made too.Organization SSO (SAML 2.0)
We’ve introduced Single Sign-On (SSO) via SAML 2.0, allowing teams to manage access through their preferred identity providers. This feature simplifies user onboarding and enhances security by centralizing authentication.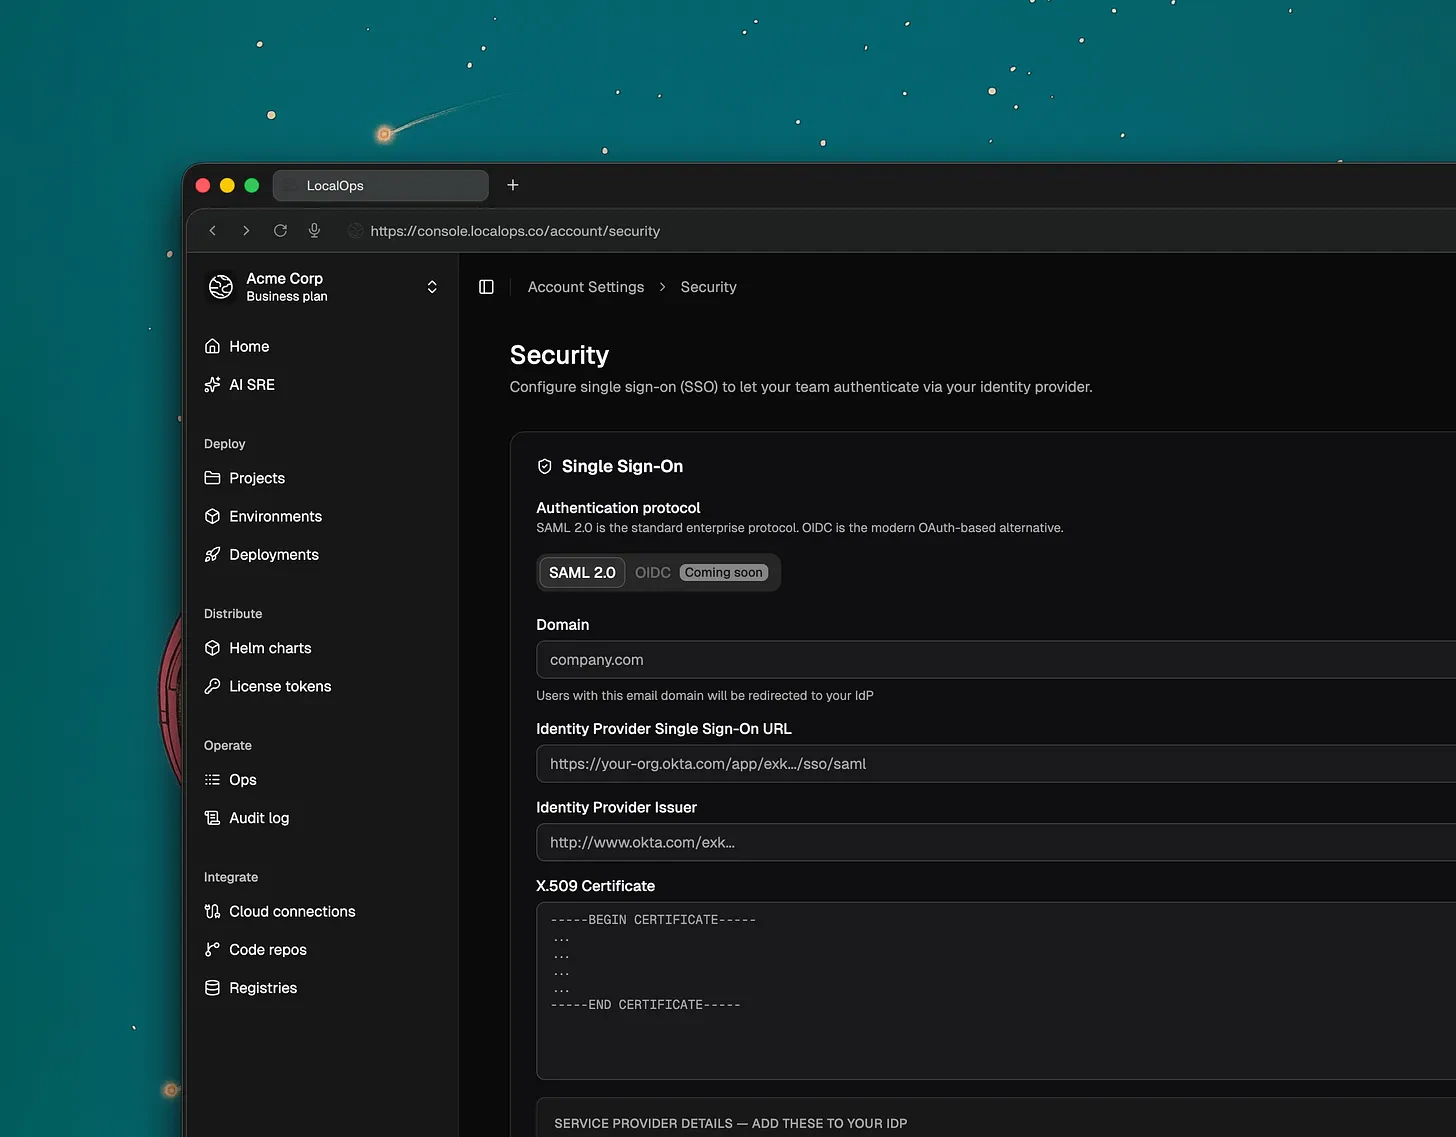
- Okta
- Microsoft Entra ID
- Google Workspace SSO
- OneLogin
- Auth0
What’s Next: OIDC (OpenID Connect) support is currently in development and will be released soon.
Improved CLI Organization Management
Users who belong to multiple organizations can now explicitly select their active organization directly within the Command Line Interface (CLI). This ensures that commands and deployments are always targeted at the correct environment without manual configuration overrides.Simplified Manual Deployments
To streamline the redeployment process, we’ve added a new option in the manual deployment section. You can now quickly select and use the last successfully deployed Docker or Helm images, reducing the risk of version mismatch during quick fixes or rollbacks.Security Improvements
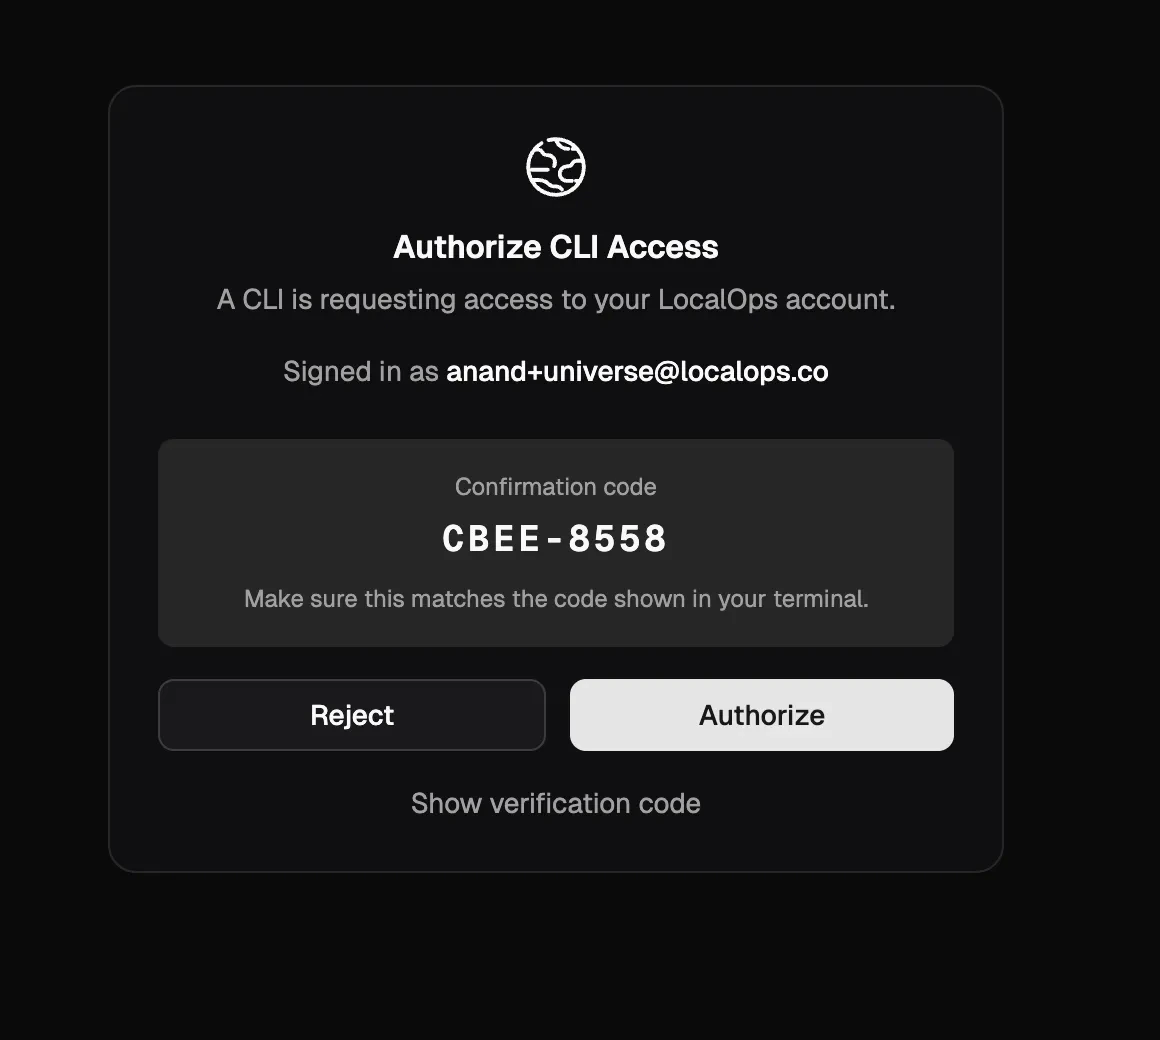
We’ve strengthened the security of our OAuth device authorization flow to further using stricter state validation and session integrity.Switch organizations/teams & New CLI update
If you run multiple products and multiple engineering teams handling their own qa, uat and production environments, you will love this update.Switch organizations:Users can now belong to multiple organizations using their same login / email address. And they can easily switch between the organizations from the top left menu like this: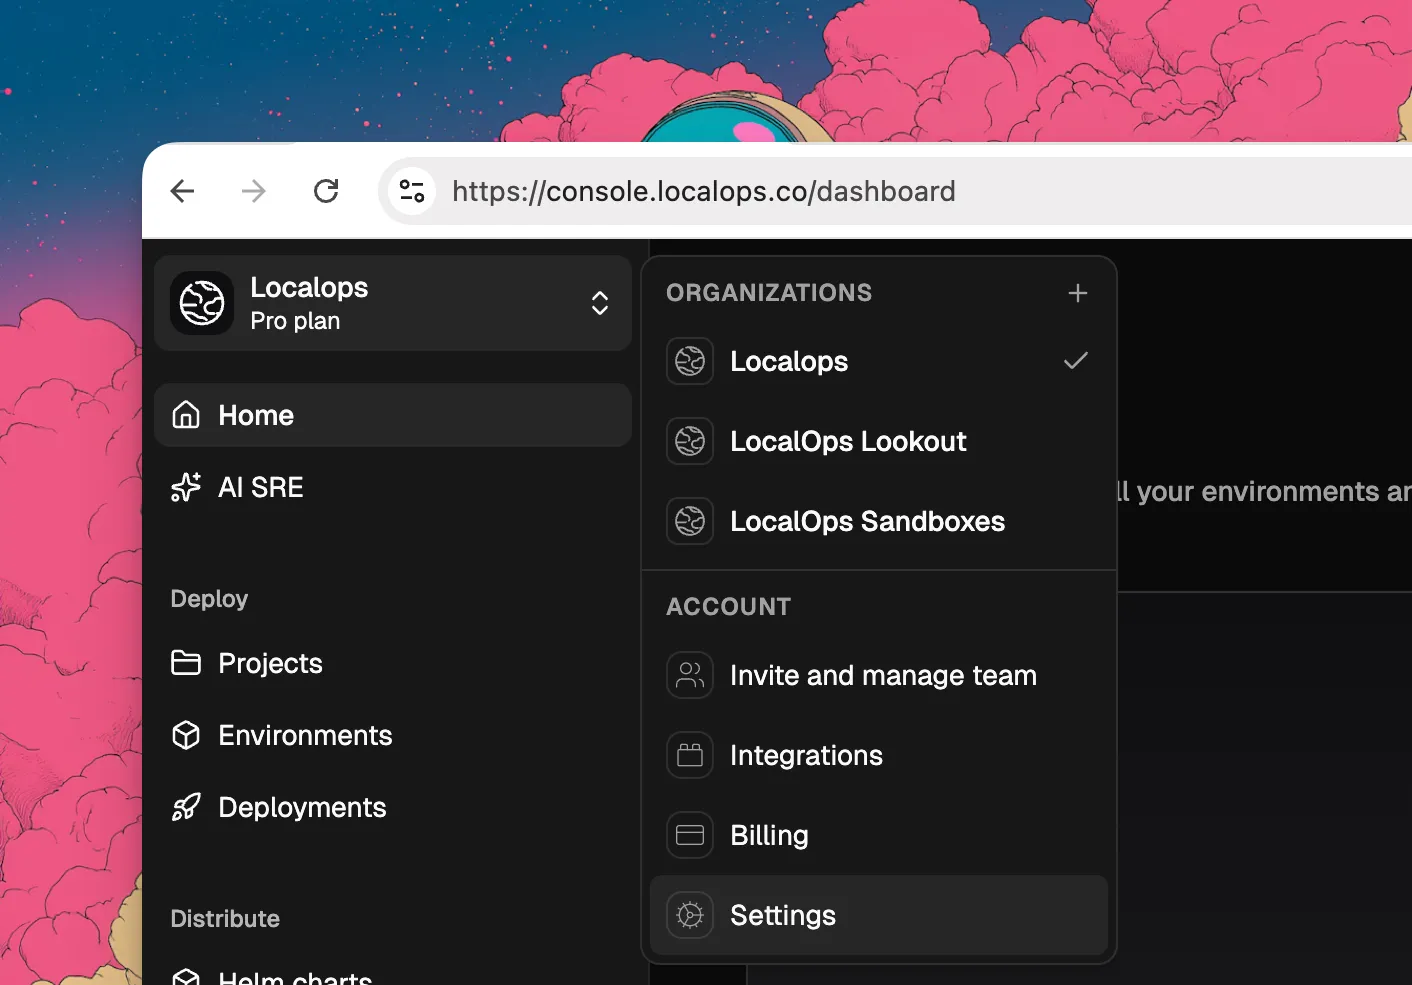
- Github org
- ECR Registries
- Environments
- qa
- uat
- production
- Deployments
Custom CIDRs for environments
While creating new environments, you can now specify custom CIDR block for your environments. This will be used to create VPCs and subnets in your cloud accounts and will give more control over your network configurations.In the Create environment page, you can click on “Advanced options” to see the new field for custom CIDR block. You can specify any valid CIDR block that you want for your environment.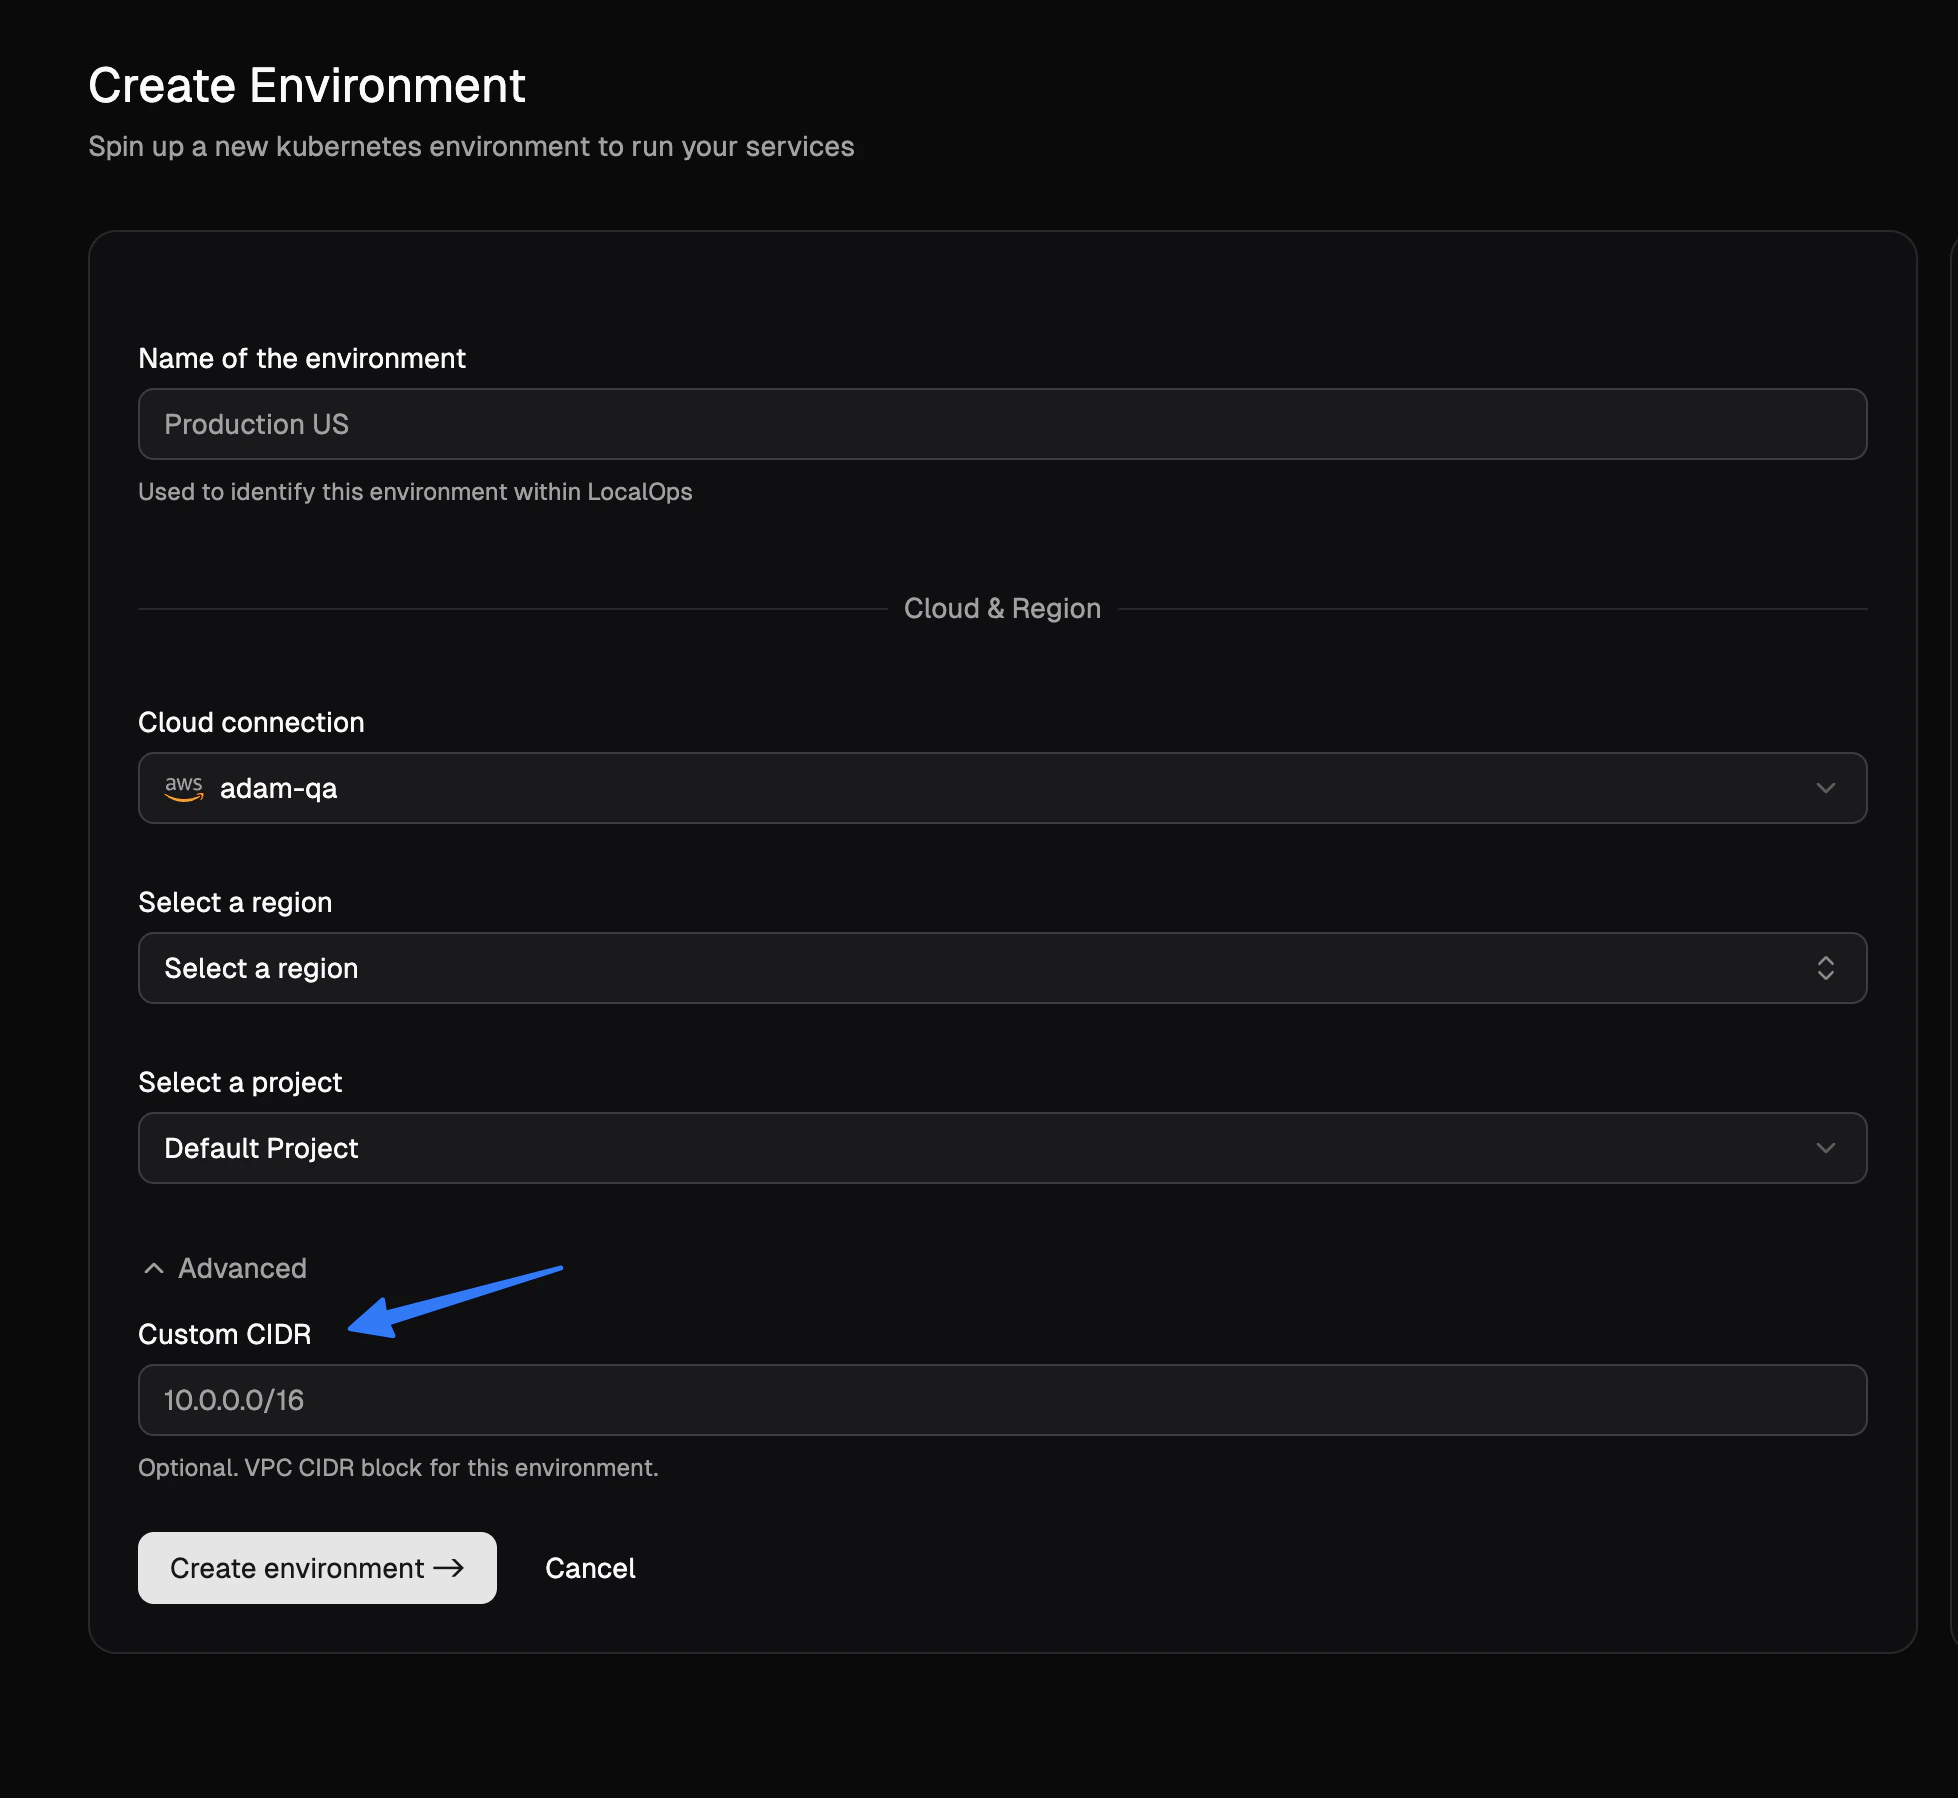
Realtime run status of services
We released a major new enhancement to services today. You can now see the realtime status of all services running within each environment, without having to use LocalOps CLI or Kubectl CLI.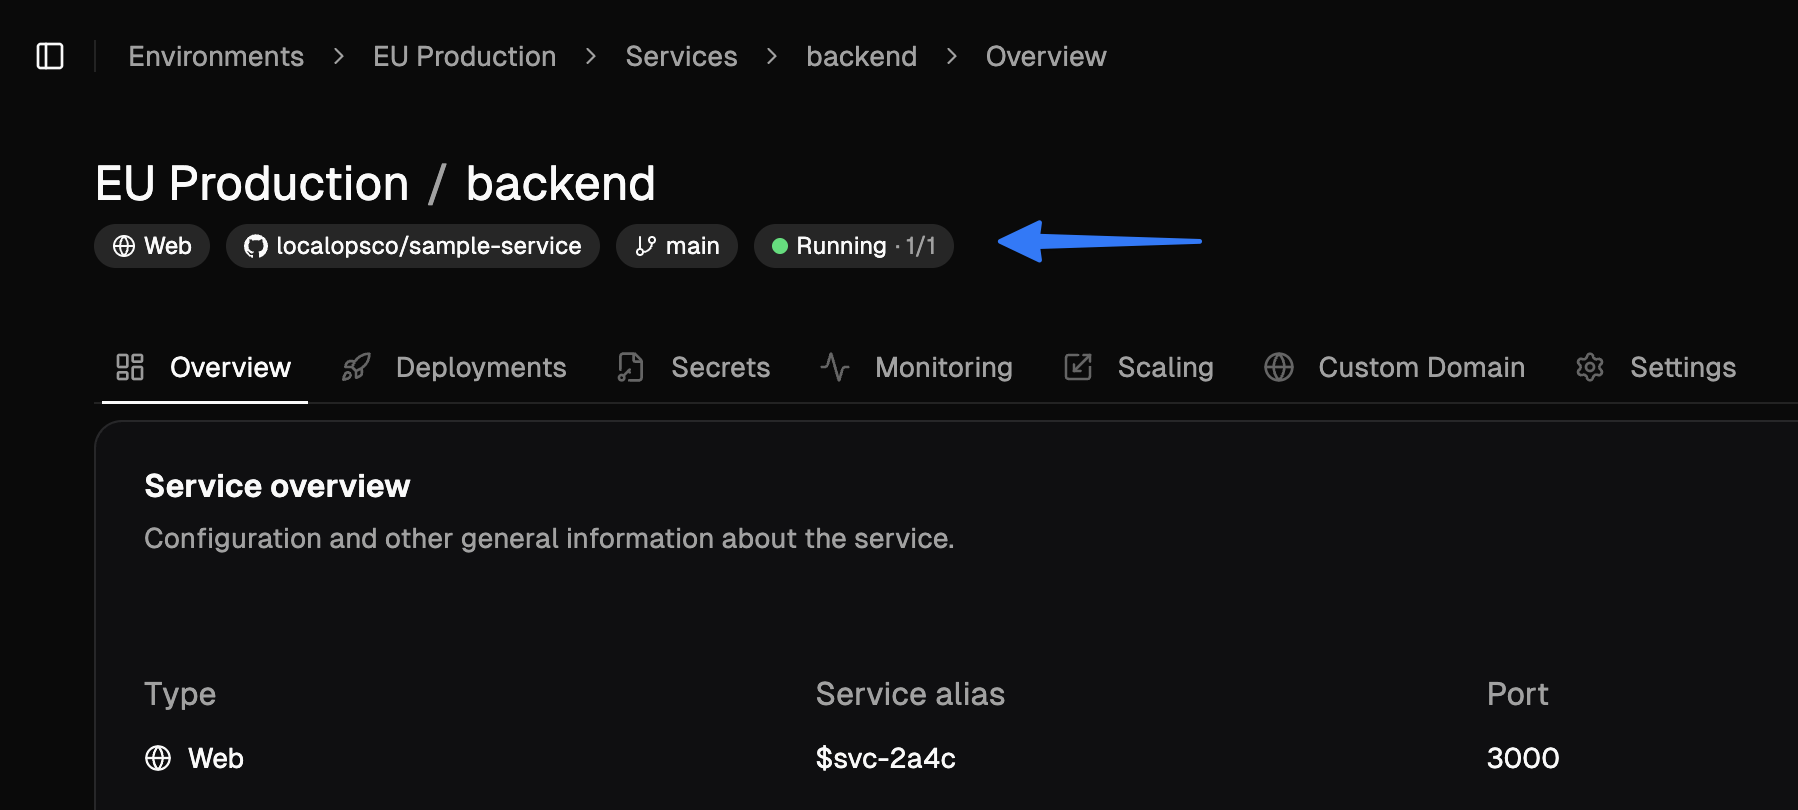
web, internal services and worker services, you will see the following statuses:- running (2/2)
- degraded (1/2)
- failing (0/2)
- stopped
- pending
- succeeded
- failed
- timeout
- idle
- active
- suspended
New “Runs” tab
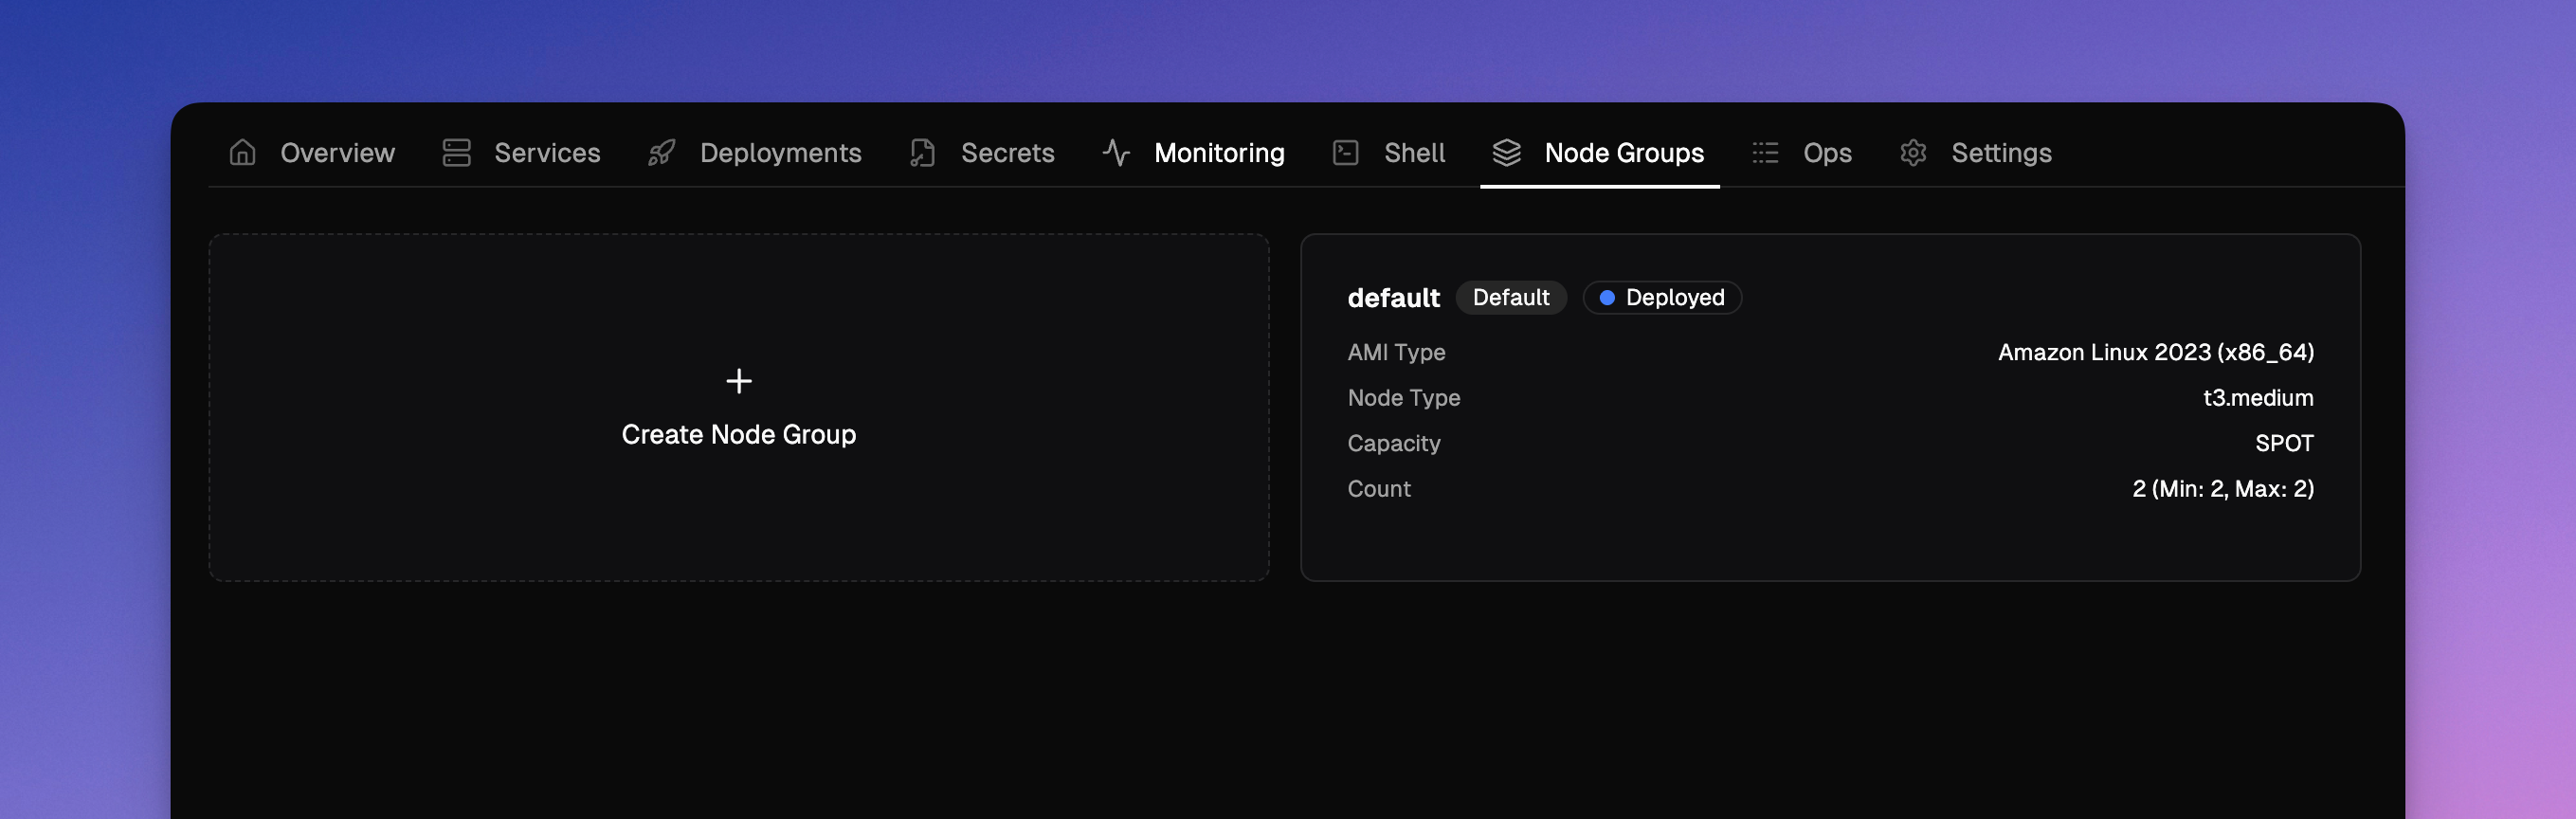
Lookout for the new “Runs” tab for job and cronjob services. You can see the run history and status of each run.We update statuses in near real time so you would know when you service is failing, just by looking at the status text in LocalOps console.All of these changes were made to make it easier for you to monitor and manage your services, without having to drop into shell or CLI.New feature: Custom Node groups
So far, environments have been having a single node group created, to run all the services.Now, you can create multiple node groups to run different types of services. For each node group you can pick- AMIs
- Instance types
- Desired count of nodes
- Windows node groups to run windows based services (or)
- Linux node groups to run linux base services
Spot instances
In the case of AWS evnironments, while creating node groups, you can pick between ON_DEMAND or SPOT as capacity types.So you can create node groups of SPOT instance type and assign interruptible and idempotent services like jobs, crons, batch processing, or other. This will end up giving up to 50% savings in compute costs.New feature: Deployment notes
While triggering new deployments, you can now pass a note text to it. And it will communicate to rest of the team about what the deployment is all about.We made other QoS updates here to ensure smooth execution of deployment pipelines.New feature: Account level resource tags
All cloud resources of all environments spinned by LocalOps are attached with two standard tags. One with ID of the environment and another with name of the environment. These tags can be used in Cost explorer to analyse costs at a granular level.We released a new feature today to accept custom tags so that you can assign your own key value pairs as tags for all resources spinned up in all environments of the account. You can use it to attach tags like:bu: internalbu: product-1project: project-name
Bring your own registry
LocalOps can now use your images from your own docker registry to deploy services in your environments. Go to the new Registries section to add any private docker registry.We support ECR & DockerHub as of today and plan to support other providers in the coming weeks.- Amazon Elastic Container Registry (ECR)
- DockerHub
- Google container registry
- Azure container registry
- Github packages
Bring your code pipeline
Deploy using LocalOps API
You can run your exisitng code build pipelines to build code and finally call LocalOps API to deploy the code to your environment. Checkout the API reference for the new /deploy api here.Eg.,🍦 Deploy using LocalOps Github action
To cut work, you can also embed our Github action step directly within your.github/workflows/deploy.yml to trigger
new deployments.Like:docker_image_tag or commit_id or helm_chart_version to the action to trigger new deployments.or with commit sha like: